The system allows teachers to track course attendance statistics. You can check how often each of your course students attends the following sections of the system:
Home
Announcements
Calendar
Documents
Learning Path
Links
Quizzes
Drop Box
Assignments
Attendance
Discussion Board
Chat
Conference
Grade Book
Mailbox
Help
Staff
Roster
Seating Chart
Wiki Pages
Besides, teachers can view the statistic information about the time user spends in the course; this item is also displayed in the Grade Book. Additionally, you can view a detailed statistics report for each course section.
The Tracking tool also enables teachers to track teachers and assistants’ statistics. Teachers can track all the above mentioned tools as well as Reports and Plagiarism.
The Learners and Groups tool statistics cannot be tracked.
|
NOTE: |
When the time is shifted, the change does not affect statistics data that have been collected before the time shift. |
To check statistics of attendance, enter the necessary course and click the Tracking icon in the Course Tools menu. The system will display an overview report for all sections:
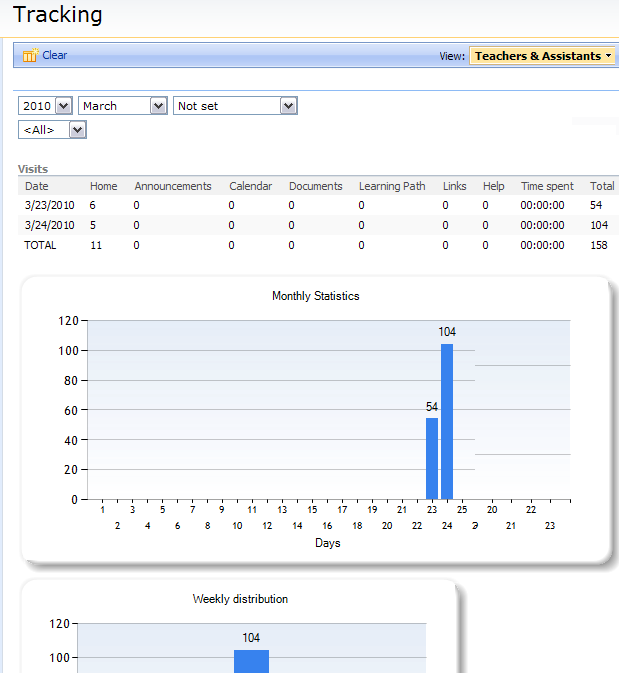
Fig. ‘Tracking’
|
NOTE: |
The way tracking counts the Gradebook stats differs from other tools:
and then the actual gradebook page which will result in 2 visits in tracking statistics.
|
The group of drop-down lists above the report table makes it possible to set filtering criteria for the statistics report: you can select for which user, year or month, or the section name the report should be generated. At the top of the Tracking page you can see a table with a statistics breakdown by days.
Below the table the system will display five graphs:
1. Year (month) statistics: shows how many times course web pages were opened (downloaded) within a certain month.
2. Daily distribution: shows how many times course web pages were opened (downloaded) during the day (on this graph an hourly breakdown is given).
3. Weekly distribution: shows how many times course web pages were opened (downloaded) during the week (on this graph a daily breakdown is given).
4. Access to tools: shows how many times web pages in various sections were opened (downloaded).
5. Most active users: shows most active users.
Use the Clear icon ( ) in the top right corner to clear report statistics.
Starting from version 2.1 the tracking uses MS Chart control for graphics.